
Independent analytics & BI consulting

Know where
the business
stands.

Clear reporting starts with numbers that hold up. I help you resolve reporting gaps, build useful dashboards, and simplify the work behind them.

Built around your reporting environment

  • Excel
  • SQL
  • Power BI
  • Tableau

Consulting services

Start with the issue
that needs attention.

You may need a new dashboard. You may need to fix the report you already have. The first step is understanding the problem.

01

Reporting & KPI review

When the numbers do not agree.

Trace the differences back to their source. Review calculations, definitions, and data quality so your team knows what needs correcting.

What you receive

Findings, metric definitions, and a prioritized correction plan.

Review my reporting
02

Dashboards & business intelligence

When performance is hard to see.

Build a focused view of the measures your team uses to run the business, with enough detail to investigate a change and understand its cause.

What you receive

A Power BI, Tableau, or Excel dashboard with documented calculations.

Discuss a dashboard
03

Reporting workflow improvement

When preparing the report takes too long.

Simplify recurring Excel and SQL work. Replace avoidable manual steps and build in checks before the next reporting cycle.

What you receive

A revised workflow, reconciliation checks, and refresh instructions.

Improve my workflow

Selected work

See how the numbers
come together.

Explore the source data, reporting logic, and final output in a downloadable example.

01 / Excel reporting · Fictional data

From a messy sales export to a report you can trace.

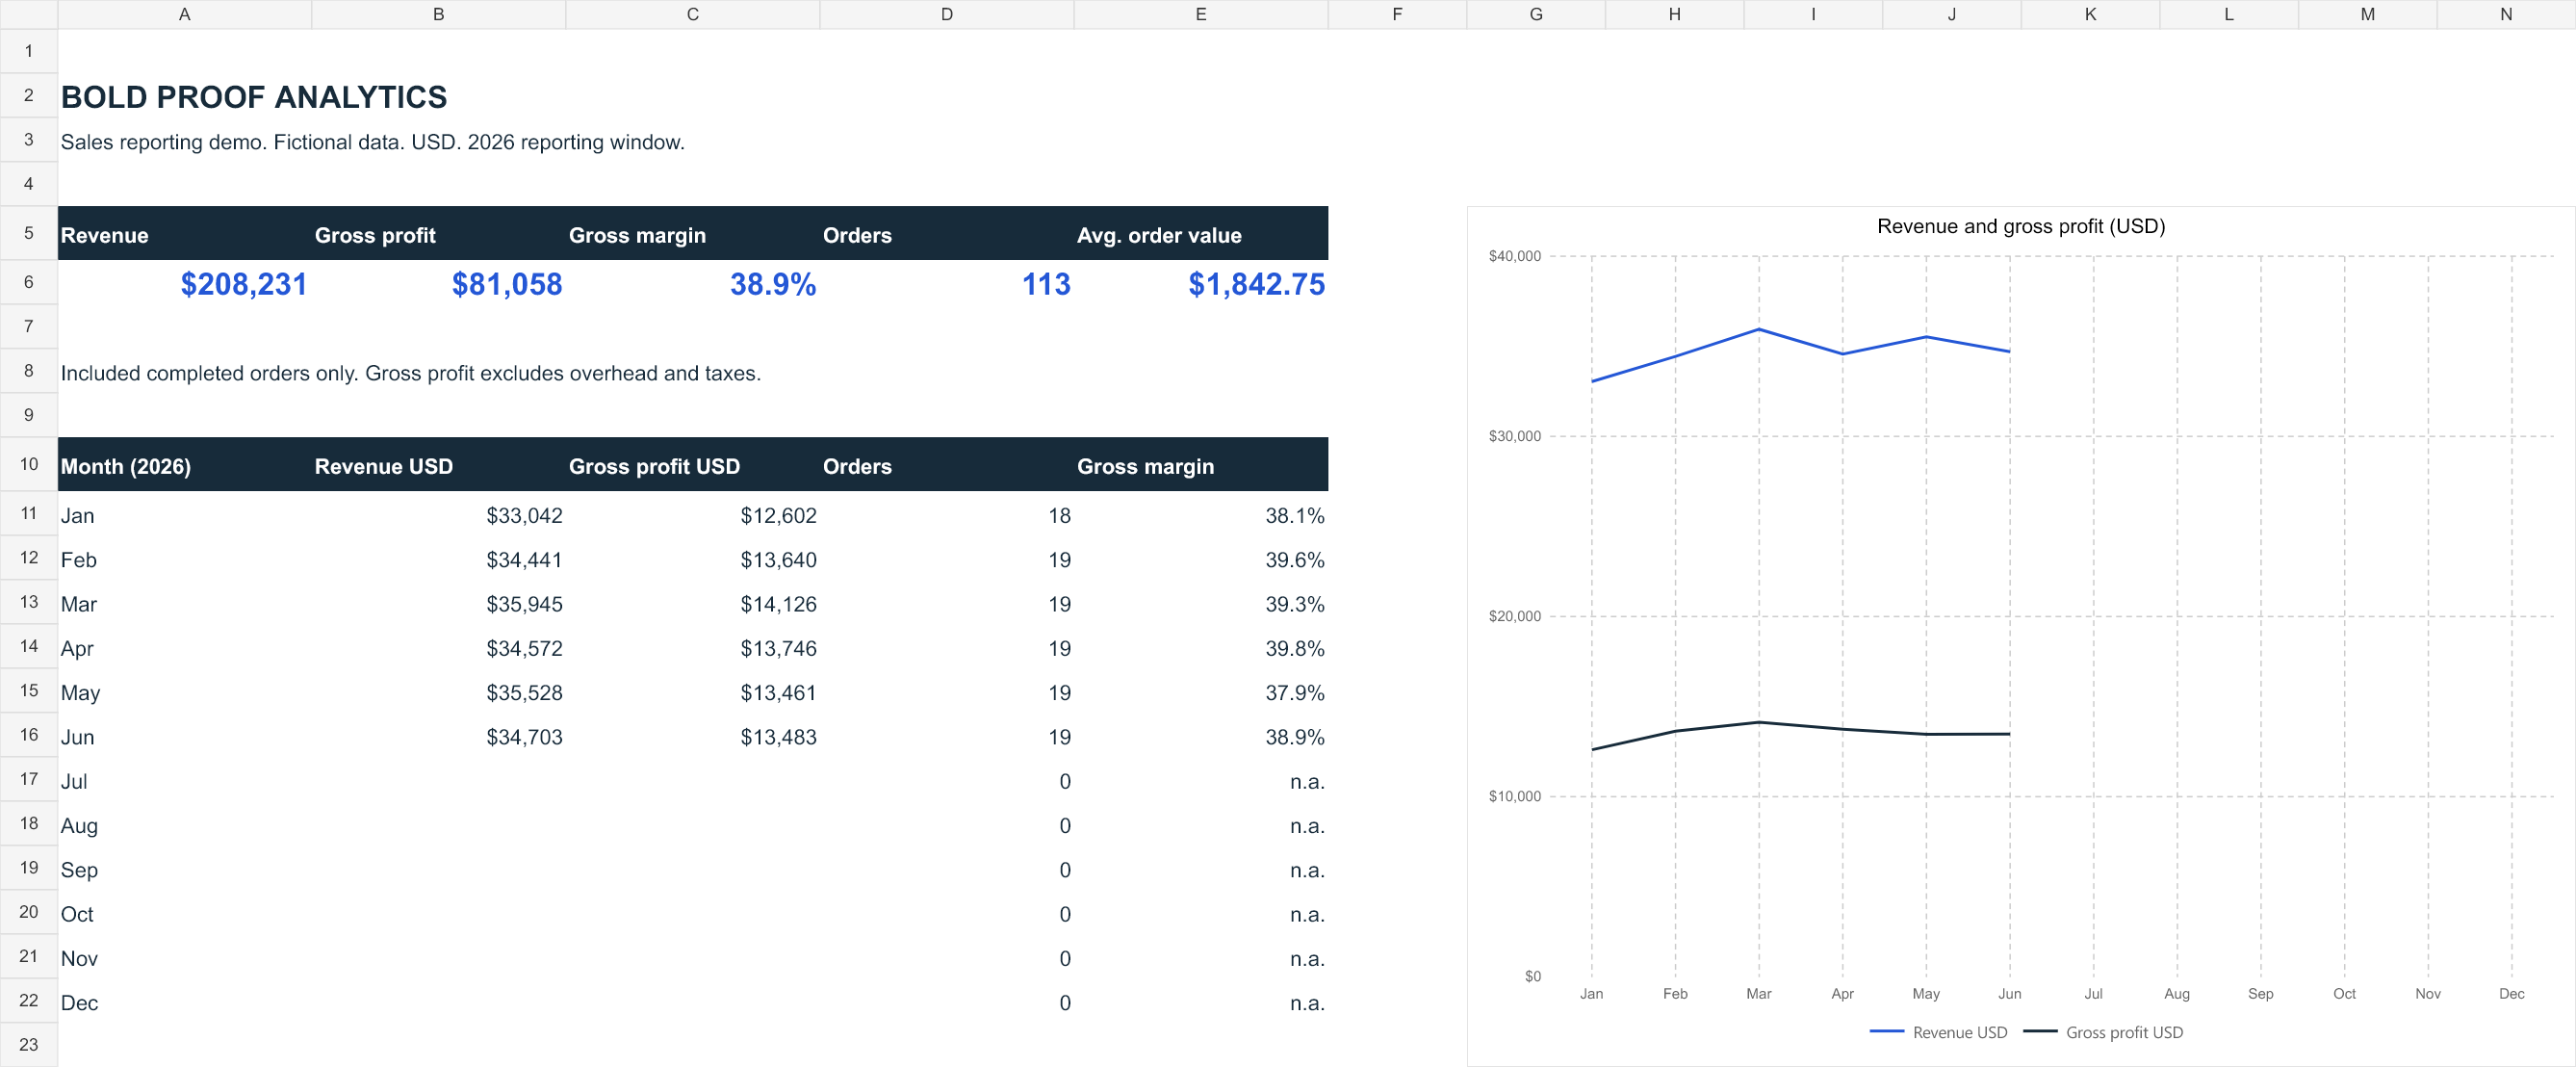
Duplicate orders, cancellations, and missing costs can distort a sales report. This workbook preserves the source records, makes exclusions visible, and calculates five KPIs from the same eligible orders.

  • Source records retained for review
  • Exclusions identified with clear reasons
  • Revenue and margin reconciled to eligible orders

Independent demonstration using fictional data; not a client engagement or evidence of commercial results.

Source data & validation notes

The complete demo kit (ZIP) includes source data, a practice export, and refresh instructions. The workbook supports up to 300 rows of 2026 order data.

Calculations and replacement-export tests passed in the authoring engine. Native Microsoft Excel verification remains outstanding; use the practice export before adapting the workbook.

Sales reporting workbookExcel / Demo
Fictional sales dashboard showing five KPIs and monthly revenue and gross profit.Open the full case study

02 / Tableau dashboards · Synthetic data

Understand the month. Trace the movement.

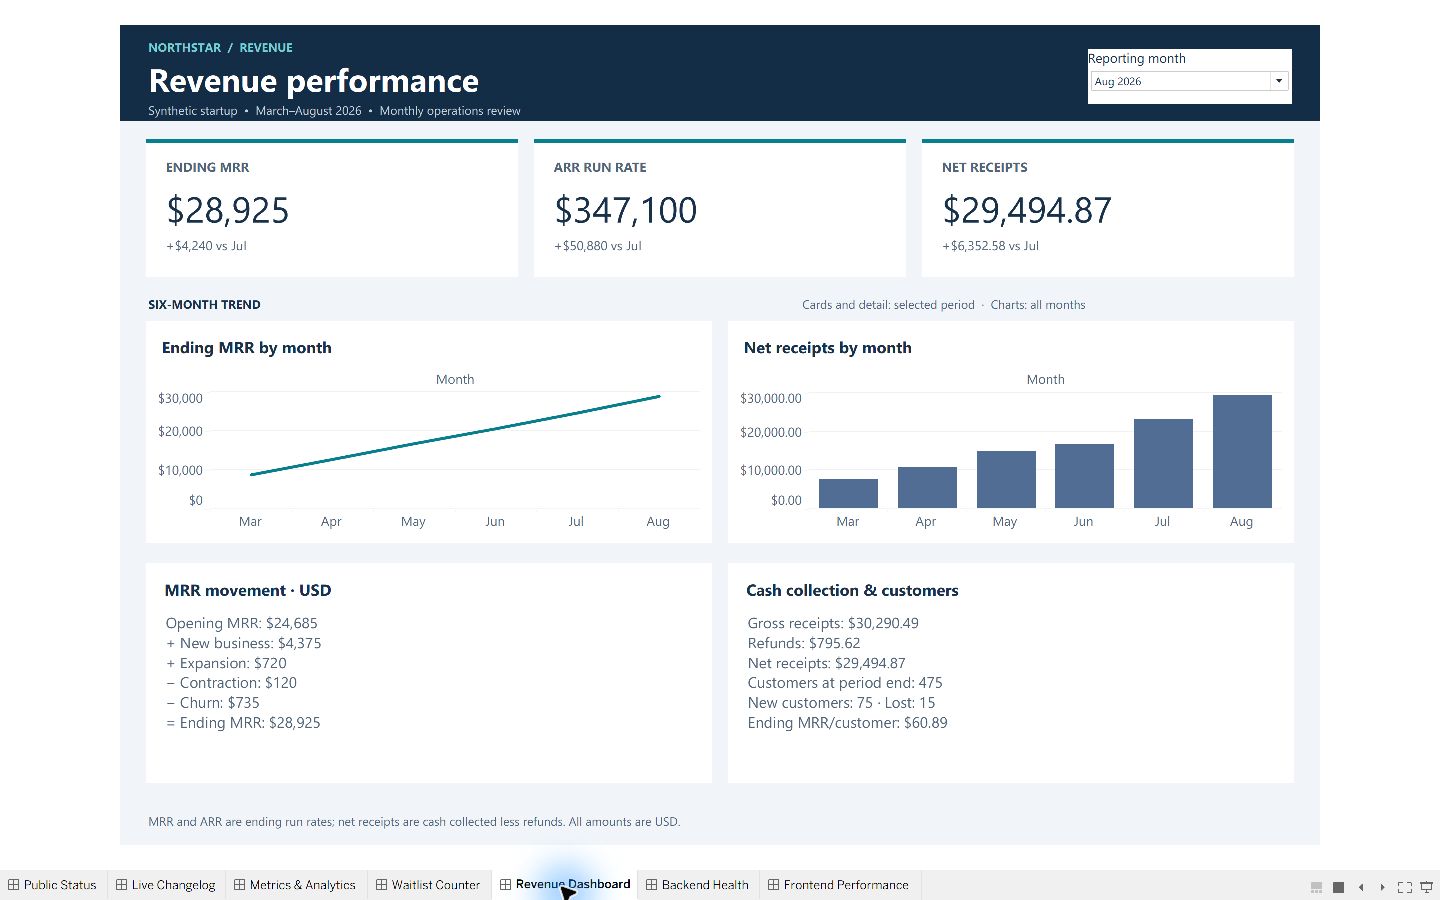
Seven dashboards bring revenue, acquisition, releases, availability, and application performance into a consistent reporting system. Monthly comparisons show what changed; supporting views explain the movement.

  • 21 headline metrics with documented definitions
  • MRR and waitlist movements reconciled to ending balances
  • 126 monthly metric values independently checked

Independent demonstration using synthetic startup data; not a client engagement or evidence of commercial results.

Workbook & validation notes

The case study includes seven native dashboards, 70 editable Tableau worksheets, screenshots, and reuse instructions. Data covers March through August 2026.

Monthly headline values and revenue and waitlist bridges were reconciled against the synthetic source data. This demonstration has no live data feed or production alerts. Replacing data requires regenerating the supporting extracts and validating the resulting workbook.

Browse the project files and verification instructions on GitHub ↗

Startup OperationsTableau / Demo
Native Tableau revenue dashboard with MRR, cash receipts, monthly comparisons, trends, and a reconciled MRR bridge, using synthetic data.Explore all seven dashboards

Working together

A defined scope.
A considered handover.

You should know what is being built, how it will be checked, and what your team will need to maintain it.

  1. 01 / Understand

    Get the question right.

    We discuss the decisions your report supports, who uses it, and where the current process falls short.

  2. 02 / Build

    Agree what good looks like.

    I propose the scope, fee, and schedule. We agree on definitions and checks before I build or revise the report.

  3. 03 / Hand over

    Make the work usable.

    We review the output against the scope. You receive the files, relevant documentation, and a walkthrough.

Your consultant

David Edmonds

Founder & Consultant

Connect on LinkedIn

Work directly with the person responsible for the report.

Bold Proof Analytics is my independent consulting practice. I work across reporting, dashboards, data quality, and operational analysis using Excel, SQL, Power BI, and Tableau.

I pay attention to the details that determine whether a report earns its place: what the measures mean, whether the numbers reconcile, and how the next person will maintain it.

Before we begin

A few practical
questions.

Can you improve an existing report?

Yes. An existing spreadsheet, dashboard, or recurring report is a useful starting point. We can focus on the definitions, calculations, layout, or refresh steps that need attention.

How are scope and fees agreed?

I review the reporting need, data sources, and expected output before proposing a fee and schedule. The proposal sets out the deliverables and exclusions; any change in scope is discussed before additional work begins.

Do I need new software?

We start with the tools you already use. If a different tool is needed, we discuss the reason, licensing, and ongoing cost before including it in the scope.

Can we work together remotely?

Yes. Project discussions, reviews, and handover can take place remotely. We agree on meeting times, communication, and data access at the start.

What should I send first?

Send a brief description of the reporting problem, your current tools, and any deadline. Leave confidential files and personal data out of the first email; we can agree on an appropriate way to share data after discussing the work.

Let’s talk

Bring the question.
We’ll define the work.

Tell me what your reporting needs to do, where it falls short, and when you need it. I’ll follow up to understand the scope and whether I can help.

Start an email to David

A useful first email includes:

  1. The report or business question
  2. Your current tools and data sources
  3. Any deadline or timing constraint

Please keep confidential files and personal data out of the first email.